library(xts)
file_id <- '1l0vupvwLZ9fGX5RHqsDGmqh0VoW11klz'
file_url <- paste0(
  'https://docs.google.com/uc?id=',
  file_id,
  '&export=download'
)
etf_raw <- read.csv(file_url)
etf <- na.omit(etf_raw[, -1])
Intro
Principal Component Analysis (PCA) is a useful tool for measuring the diversification potential of an asset or group of assets within a portfolio. PCA is also a dimensionality reduction tool, which is very handy because the traditional measure of diversification, pairwise correlations, increase exponentially with the number of assets at a rate of n * (n-1) / 2. This post will show an example of a portfolio with 13 assets which creates 78 correlations. Reducing the 78 different cross relationships between assets down to 3 or 4 buckets of risk allows us to focus on asset allocation decisions that will meaningfully affect the overall portfolio risk.
PCA works by combining our universe of assets into linear combinations of itself. This is different than traditional asset taxonomy that group based on a qualitative understanding of the asset. Having an economic rationale for assets classes is vital. For example, grouping small and large cap stocks together makes sense because the same economic forces (monetary policy, GDP growth, credit conditions, etc) drive both assets. However, some assets don’t fall cleanly within one group, e.g., Real Estate is driven by forces that effect both bonds (e.g., interest rates) and equities. PCA is a nice complement to traditional asset class definitions because it can find latent sources of risk that we may have overlooked or not properly split between asset classes. Furthermore it can help test if alternative asset classes such as Merger Arbitrage are unique sources of risk or a linear combination of traditional assets.
The next sections will set up a portfolio of 13 ETFs to proxy different asset classes and run the PCA.
Data
| Ticker | Proxy |
|---|---|
| VOO | U.S. Large Cap Equity |
| IEFA | International Developed Equity |
| VWO | Emerging Markets Equity |
| TLT | Long Duration Bonds |
| AGG | U.S. Core Bonds |
| TIP | Inflation Protected Bonds |
| HYG | High Yield Bonds |
| EMB | Emerging Market Bonds |
| VNQ | U.S. Real Estate |
| AMLP | MLPs |
| GSG | Broad Basket Commodities |
| PQTIX | Trend Following |
| MERIX | Merger Arb |
The following code downloads a time-series of historical returns from 1/3/2014 to 4/5/2024 from a public CSV file in my Google Drive. This is a great free tool to share non sensitive CSV files for other R users to download and reproduce your research / analysis. There’s two steps: 1) set the sharing access of the file to “anyone with a link can view”; and 2) extract the file ID by copying and pasting the link in a text editor. The code snippet below shows how to plug the ID into the file_id string to set up the file_url to pass to the read.csv function below.
PCA
One of the great things about R is the all the different fields of research that contribute to its ecosystem of libraries. This is true of statistics as well: many different disciplines apply and advance its methods. In this case, I’m demonstrating PCA through the psych package which is “a general purpose toolbox developed originally for personality, psychometric theory and experimental psychology.” princomp and prcomp from the stats package also perform PCA, however I am using the pca from psych because it has a built in varimax rotation method, which is a way of making the output of PCA easier to interpret. It’s fitting that the pysch PCA function has this feature built in, clicking through the varimax link above will show its introduction in the abstract of a 1958 publication in a popular psychometric journal. It’s amazing what can be borrowed from other fields: the next section highlights a clustering around latents technique that introduced in an academic paper to reduce the dimensionality of the sensory attributes of different kinds of wine.
Here’s the simple snippet that removes the dates from our time-series and runs the PCA function.
library(psych)

obs <- etf[, -1]
p <- psych::pca(cor(obs), nfactors = 3)
print(p)
Principal Components Analysis
Call: principal(r = r, nfactors = nfactors, residuals = residuals,
rotate = rotate, n.obs = n.obs, covar = covar, scores = scores,
missing = missing, impute = impute, oblique.scores = oblique.scores,
method = method, use = use, cor = cor, correct = 0.5, weight = NULL)
Standardized loadings (pattern matrix) based upon correlation matrix
RC1 RC2 RC3 h2 u2 com
VOO 0.91 -0.09 0.15 0.87 0.13 1.1
IEFA 0.89 -0.04 0.21 0.85 0.15 1.1
VWO 0.81 -0.04 0.23 0.71 0.29 1.2
TLT -0.16 0.92 -0.17 0.90 0.10 1.1
AGG 0.18 0.93 -0.05 0.90 0.10 1.1
TIP 0.03 0.89 0.18 0.83 0.17 1.1
HYG 0.84 0.18 0.18 0.77 0.23 1.2
EMB 0.69 0.53 0.19 0.79 0.21 2.0
VNQ 0.82 0.13 0.02 0.69 0.31 1.1
AMLP 0.48 0.01 0.67 0.67 0.33 1.8
GSG 0.18 -0.02 0.90 0.84 0.16 1.1
PQTIX -0.29 -0.06 -0.17 0.12 0.88 1.7
MERIX 0.64 -0.07 0.23 0.47 0.53 1.3
RC1 RC2 RC3
SS loadings 4.97 2.85 1.59
Proportion Var 0.38 0.22 0.12
Cumulative Var 0.38 0.60 0.72
Proportion Explained 0.53 0.30 0.17
Cumulative Proportion 0.53 0.83 1.00
Mean item complexity = 1.3
Test of the hypothesis that 3 components are sufficient.
The root mean square of the residuals (RMSR) is 0.05
Fit based upon off diagonal values = 0.99Looking at the output we can see our loadings and the portion of variance explained by the first 3 components. We’ll later explore why 3 were chosen vs. 4, or 5, or n, but for now we can see larger loadings of equity, high yield and EM bonds, and real estate on the first factor. The investment grade fixed income assets (duration) load on the second factor and commodities and MLPs load on the third. Trend following has a modest negative loading on the “equity” component but doesn’t really map onto any of the three components. The other key item we can see from the output is the Porportion of Variance explained by each component. 38% is explained by the first component, 60% by the first and second, and 72% by all three. This is a key feature of PCA, the first component is the linear combination of assets that explain the most variance (equity-like in this case), then the next iteration tries to explain the maximum amount of remaining variance. This will continue until we stop at given number (3 in this case) or can continue to \(n\) assets (13 in this example). Each iteration will explain a smaller amount of variance and the latter factors at some point will become noise. There’s enough debate and nuance as to where to stop the PCA that I’ll dedicate a separate post to the subject, for now we can examine three vs. four to see the diversification potential of our asset universe.
Plotting a bar graph of the three loadings is a helpful way to visualize our groups.
library(ggplot2)
library(tidyr)

plot_pca <- function(p) {
  df <- data.frame(ETF = colnames(obs), p$loadings[,])
  plot_df <- pivot_longer(df, cols = -ETF, names_to = 'RC', values_to = 'Loading')
  plot_df$ETF <- factor(plot_df$ETF, rev(df$ETF))
  ggplot(plot_df, aes(y = ETF, x = Loading, fill = RC)) +
    geom_bar(stat = 'identity') +
    facet_wrap(.~RC)
}
plot_pca(p)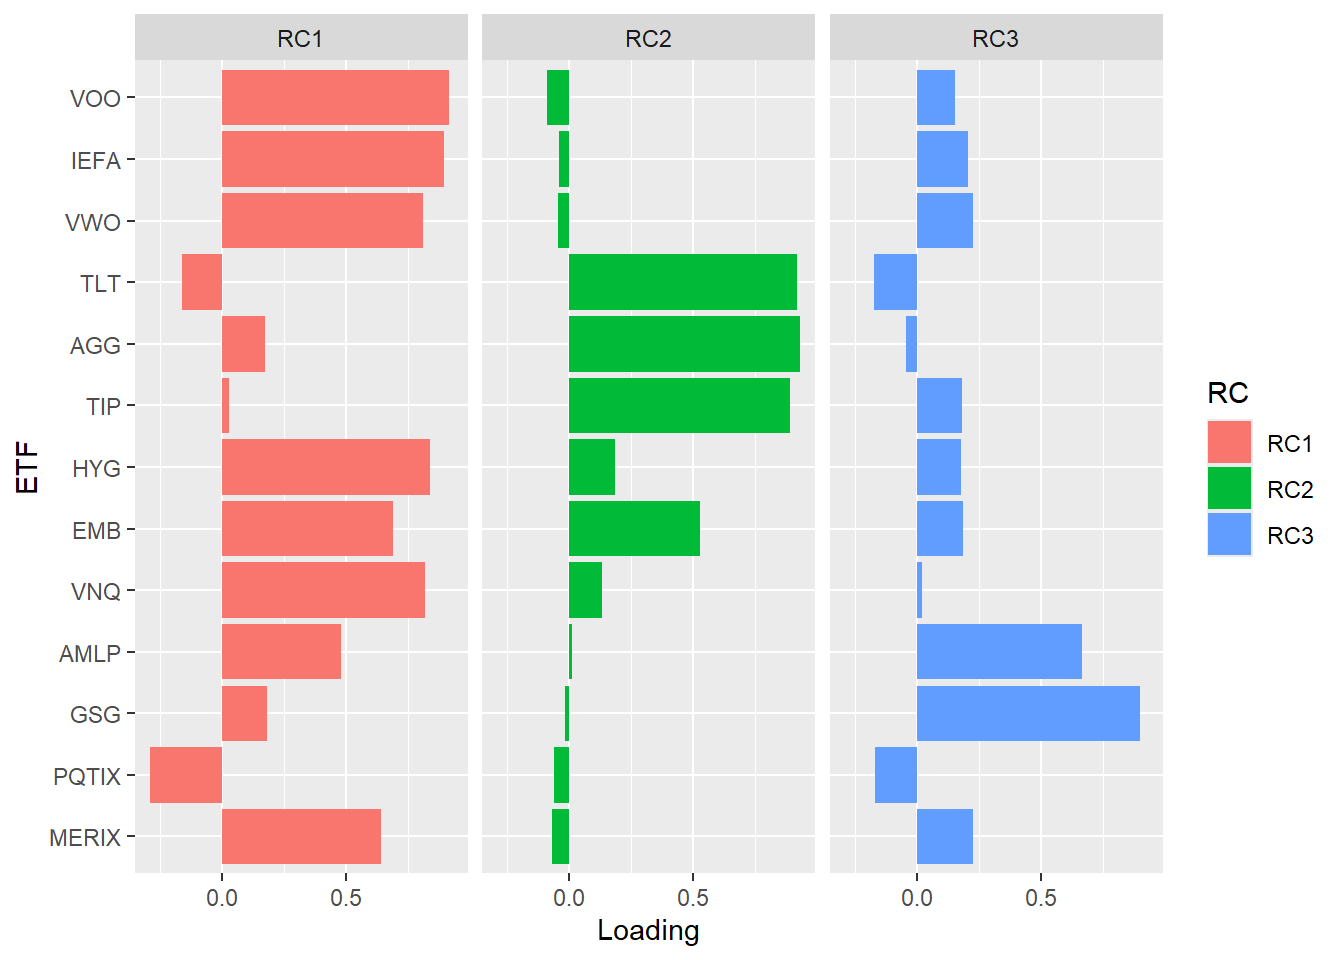
Let’s see what happens if we expand to 4 components.
p2 <- psych::pca(obs, 4)
print(p2)
Principal Components Analysis
Call: principal(r = r, nfactors = nfactors, residuals = residuals,
rotate = rotate, n.obs = n.obs, covar = covar, scores = scores,
missing = missing, impute = impute, oblique.scores = oblique.scores,
method = method, use = use, cor = cor, correct = 0.5, weight = NULL)
Standardized loadings (pattern matrix) based upon correlation matrix
RC1 RC2 RC3 RC4 h2 u2 com
VOO 0.92 -0.08 0.15 -0.03 0.88 0.1225 1.1
IEFA 0.89 -0.04 0.20 -0.09 0.85 0.1528 1.1
VWO 0.82 -0.04 0.22 -0.03 0.72 0.2802 1.2
TLT -0.16 0.92 -0.17 0.05 0.90 0.0983 1.1
AGG 0.16 0.93 -0.06 -0.08 0.90 0.1017 1.1
TIP 0.03 0.89 0.18 0.01 0.83 0.1702 1.1
HYG 0.83 0.19 0.16 -0.12 0.77 0.2278 1.2
EMB 0.68 0.53 0.17 -0.14 0.79 0.2144 2.1
VNQ 0.82 0.14 0.02 -0.04 0.69 0.3080 1.1
AMLP 0.48 0.02 0.66 -0.10 0.68 0.3244 1.9
GSG 0.19 -0.01 0.90 -0.02 0.86 0.1449 1.1
PQTIX -0.17 -0.03 -0.07 0.98 0.99 0.0076 1.1
MERIX 0.64 -0.07 0.22 -0.11 0.47 0.5299 1.3
RC1 RC2 RC3 RC4
SS loadings 4.89 2.85 1.54 1.03
Proportion Var 0.38 0.22 0.12 0.08
Cumulative Var 0.38 0.60 0.71 0.79
Proportion Explained 0.47 0.28 0.15 0.10
Cumulative Proportion 0.47 0.75 0.90 1.00
Mean item complexity = 1.3
Test of the hypothesis that 4 components are sufficient.
The root mean square of the residuals (RMSR) is 0.04
with the empirical chi square 719.27 with prob < 1.1e-130
Fit based upon off diagonal values = 0.99plot_pca(p2)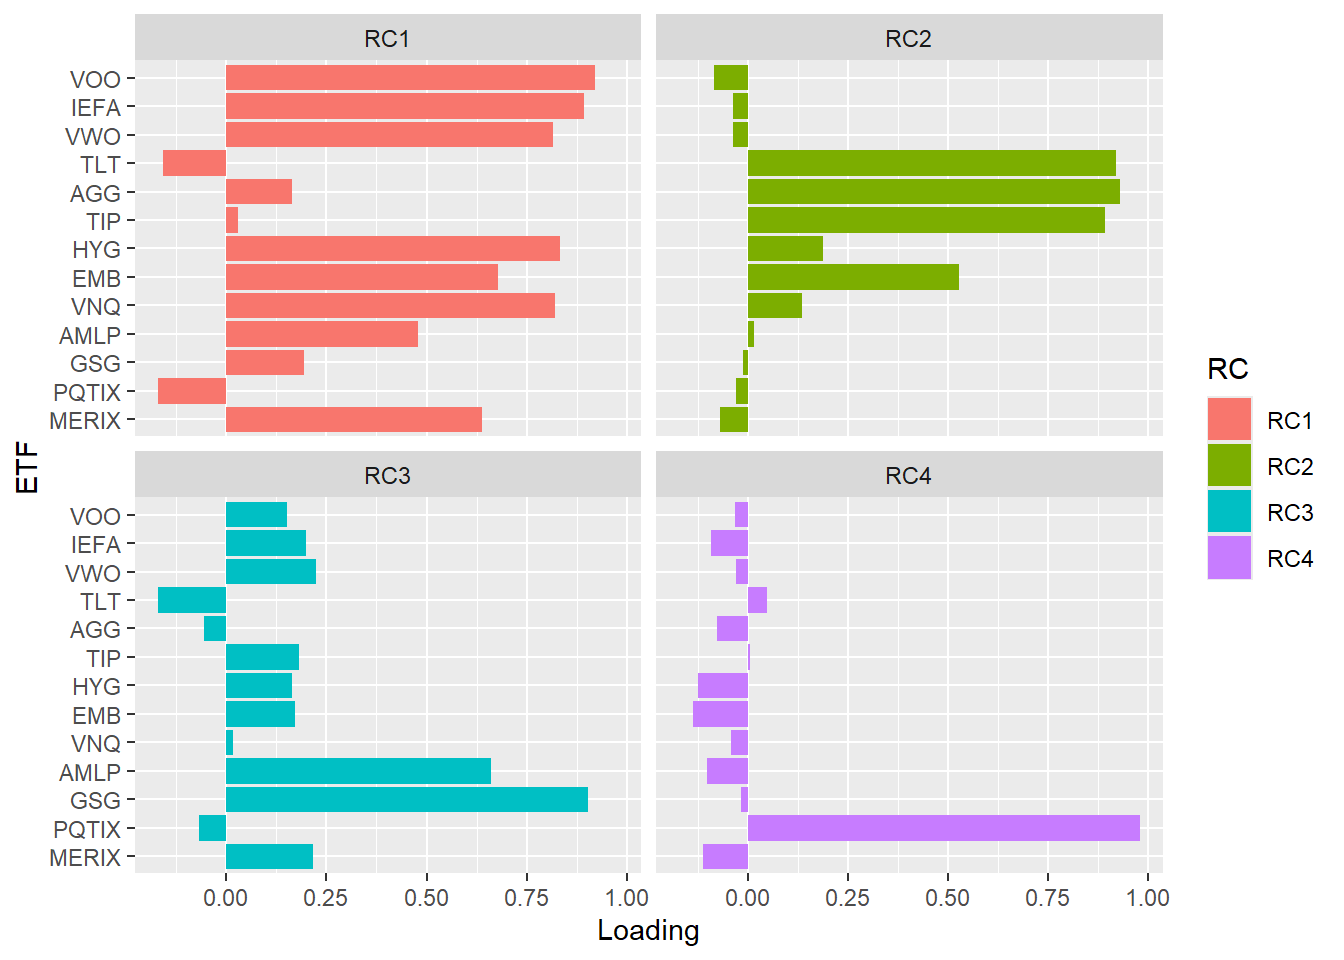
The incremental variance explained wasn’t much, we went from 72% to 79%, but we did create a loading for trend following. Put another way, the fourth component shows that trend following is unique compared to the other asset groups and is essentially its own component. The proportion of explained variance doesn’t increase much because only one additional asset (out of 13) is explained by adding another component, but the component is insightful in that it shows the diversification potential of this asset.
Clustering Around Latents
A more formal way of creating groups out of our asset universe is to combine hierarchical clustering with PCA. An open source technique is outlined in the R Journal Article: ClustVarLV: An R Package for the Clustering of Variables around Latent Variables. Clustering around Latent Variables is a mouthful which the authors shorten to CLV. The CLV approach deploys a partitioning algorithm similar to k-means. The partitioning - described in detail in Vigneau and Qannari (2003) - attempts to maximize a criterion that measures which variables within a cluster are related to the latent variable (from the PCA) associated with the cluster. The key hyperparameter is the \(k\) groups or clusters to specify. The authors propose two graphs to help set \(k\). Let’s take a look at both with our example.
The CLV function runs the algorithm introduced in the research article and charts the two plots to help set \(k\).
library(ClustVarLV)
clv_res <- CLV(obs, method = 2, graph = FALSE)
plot(clv_res, 'delta')
The delta plot shows the difference of the clustering criterion as we move from \(k\) to \(k-1\) clusters. The authors propose that when we see this delta increase from the asymptote we set our \(k\). Using graphs to determine \(k\) can be challenging, sometimes you have to squint, in this case it looks like going from 4 to 3 marks the first jump, which indicates \(k = 4\).
plot(clv_res, 'dendrogram')
The dendrogram is also useful. The chart is meant to be read top to bottom in terms of the group hierarchies (the more meaningful breaks occur at the top). The first break separates equity-like assets and commodities from bonds and trend following. On the left side the next break seperates out commodites. On the right side the next break seperates bonds and trend following. This follows the PCA loadings from the 4 factor run above. We could continue to drill down on the left hand side. To the far left the three equity indexes group together and at the most granular U.S. and Developed International group while Emerging Markets break out. High Yield and Emerging Bonds group with Real Estate while Merger Arb forms its own node. Further down the bonds group together and Real Estate breaks off. On the right side Long Duration and Core bonds group while TIPs separate. Another useful way to view this graph is understanding the length of the line under each asset is proportionate to its diversification potential (longer = more diversification). Given this group of assets it’s not surprising the Merger Arb and Trend Following have the longest lines.
summary(clv_res, 4)$number
clusters
1 2 3 4
7 3 2 1
$groups
$groups[[1]]
cor in group cor next group
VOO 0.91 0.50
IEFA 0.91 0.52
HYG 0.87 0.48
VWO 0.84 0.49
VNQ 0.81 0.38
EMB 0.77 0.49
MERIX 0.69 0.42
$groups[[2]]
cor in group cor next group
TLT 0.93 0.05
AGG 0.93 0.25
TIP 0.90 0.16
$groups[[3]]
cor in group cor next group
AMLP 0.87 0.58
GSG 0.87 0.38
$groups[[4]]
cor in group cor next group
PQTIX 1 -0.04
$set_aside
NULL
$cormatrix
Comp1 Comp2 Comp3 Comp4
Comp1 1.00 0.12 0.55 -0.28
Comp2 0.12 1.00 -0.01 -0.04
Comp3 0.55 -0.01 1.00 -0.19
Comp4 -0.28 -0.04 -0.19 1.00The summary function gives a nice output of our groups and their correlations. The group correlation is an equal weighted average, you could think of the group as a portfolio with equal weights. The correlation within the group and the correlation to the next group are good sanity checks on our clusters. The correlation matrix of the groups or components below is also useful. In this case we can see the commodity and equity correlation is moderately high at 0.55. In a similar vein, the MLPs correlation to the next group (equities) is also moderately high at 0.58. This is also mirrored in the PCA analysis where AMLP loaded on both the equity and commodity groups.
Dropping to \(k=3\) (below) buckets the MLP and Commodity ETFs with the equity group. This creates the trade off of having slightly lower in group correlation at the bottom of this group (GSG at 0.53) but more orthogonal group correlations at the bottom (highest magnitude is -0.28 between trend following and equities or r-squared of 7.8%).
summary(clv_res, 3)$number
clusters
1 2 3
9 3 1
$groups
$groups[[1]]
cor in group cor next group
VOO 0.89 -0.06
IEFA 0.89 -0.02
HYG 0.85 0.18
VWO 0.83 -0.02
VNQ 0.77 0.14
EMB 0.75 0.49
AMLP 0.71 0.01
MERIX 0.68 -0.04
GSG 0.53 -0.03
$groups[[2]]
cor in group cor next group
TLT 0.93 0.05
AGG 0.93 0.22
TIP 0.90 0.17
$groups[[3]]
cor in group cor next group
PQTIX 1 -0.04
$set_aside
NULL
$cormatrix
Comp1 Comp2 Comp3
Comp1 1.00 0.10 -0.28
Comp2 0.10 1.00 -0.04
Comp3 -0.28 -0.04 1.00The drawback of this technique is setting \(k\) can be part art and science when it comes to these trade-offs. However, the analysis on the whole has many benefits. We can quickly see what are the most diversifying assets are and measure where a potential new asset fits in our portfolio (or perhaps adds another group of diversifying risk). The dendrogram is useful for understanding as we start at the top of our portfolio’s buckets of risk and move down where we’re getting the marginal benefit of diversification when allocating across assets.
The application has additional uses beyond measuring portfolio risk groups. For example, we could apply the clustering on a universe of U.S. equity managers. Even within a category such as value there can be dispersion between styles such as deep value and the intersection of value and profitability. Throwing in indexes can also help see which managers are closer to the index definition of their style or are doing something more unique (farther away from the index or crowd in the dendrogram). Of course this is meant to be one tool used with a variety of others including a thorough understanding of the managers’ process, team, etc. Picking managers or assets solely on how far away they on a dendrogram or clustering analysis will almost certainly lead to poor results!